as this is my first blog entry, some things about me. My name is Hannes (short for Johannes) and I'm German (which will explain my grammar and love for long sentences). I previously studied math in Germany and am now doing a PhD in bioinformatics (this part explains my interest in data). I also play very unprofessional basketball and try to actively follow the NBA (as actively as it is possible for not being able to watch the games live due to things like time zones).
I recently started to dive head first into the data on http://stats.nba.com and started a small program that I called SportsTribution1. SportsTribution allows to look at two information of data at the same time and you will see more about it very soon. I am sure that some people will find it crowded, but I promise that the four readers that are still reading right now will quickly get used to it.
It is available for free (right now only upon request, but I promise to quickly change this) and I am happy for any kind of critic (other than 'your stuff sucks!' of course...). Also feel free to publish content created by it.
SportsTribution is a great way to see outliers that are usually hidden, because they concern more than one type of data at the same time. My favorite example (up to now) is a plot called 'Josh McRoberts treats the ball like it's a hot potato!'
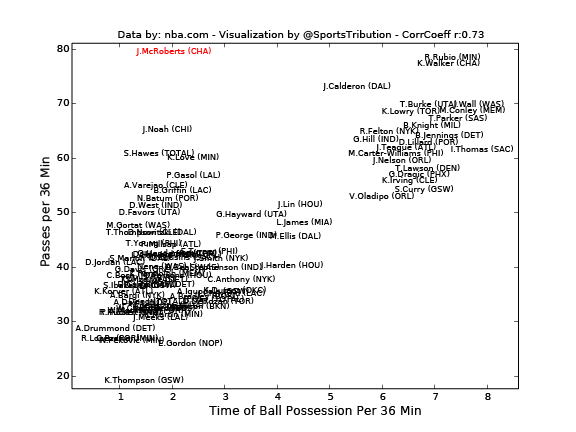 |
| Comparing minutes of ball possession with the number of passes. Both values are normalized so that every player would play 36 minutes per game. Players are filtered by games (at least 40) and minutes per game (at least 30). Data published on nba.com on the 24/02/2014 |